Servers & monitoring

VictoriaMetrics Community
Open-source time-series database and monitoring backend, with a built-in query UI.
Release notes / v1.156.0
Released 2026-11-09. Snapshot from the included release data, not a live check.
## [v1.156.0](https://github.com/VictoriaMetrics/VictoriaMetrics/releases/tag/v1.156.0) Released at 2026-11-09 * FEATURE: all VictoriaMetrics [Enterprise](https://docs.victoriametrics.com/victoriametrics/enterprise/) components: run with the `-eula` command-line flag to accept [ESA](https://victoriametrics.com/legal/esa/). License keys are no longer verified. The `-license`, `-licenseFile`, `-licenseFile.reloadInterval` and `-license.forceOffline` flags are deprecated and are treated as `-eula`, so existing setups keep working. See [Running VictoriaMetrics Enterprise](https://docs.victor
Read the full release notes on GitHub ↗Available on these platforms
Requires a self-hosted VictoriaMetrics server.
Server systems, compatibility details and official sources
VMUI is a browser interface to a VictoriaMetrics server. This does not assert a native mobile client or that the database service runs on the phone.
Official availability checked 2026-11-12. Availability is not feature parity. The recorded release and license refer to the linked source project; separate clients can differ. No install or compatibility test was run.
Before you install
Fast time-series storage that pairs with Grafana.
- What does it run on?
- A single-node server (binary, Docker or packages). This page covers the open-source single-node server, not the enterprise features or VictoriaMetrics Cloud.
- Where is my data?
- Metrics live on your server; query it with its API or point Grafana at it for dashboards.
- What will I maintain?
- The server, storage growth and retention settings. Apache-2.0 community code; enterprise and cloud are separate offerings.
Advice and funding routes source-checked November 12, 2026. Researched, not an install or restore test. Installation source ↗ · Report a correction
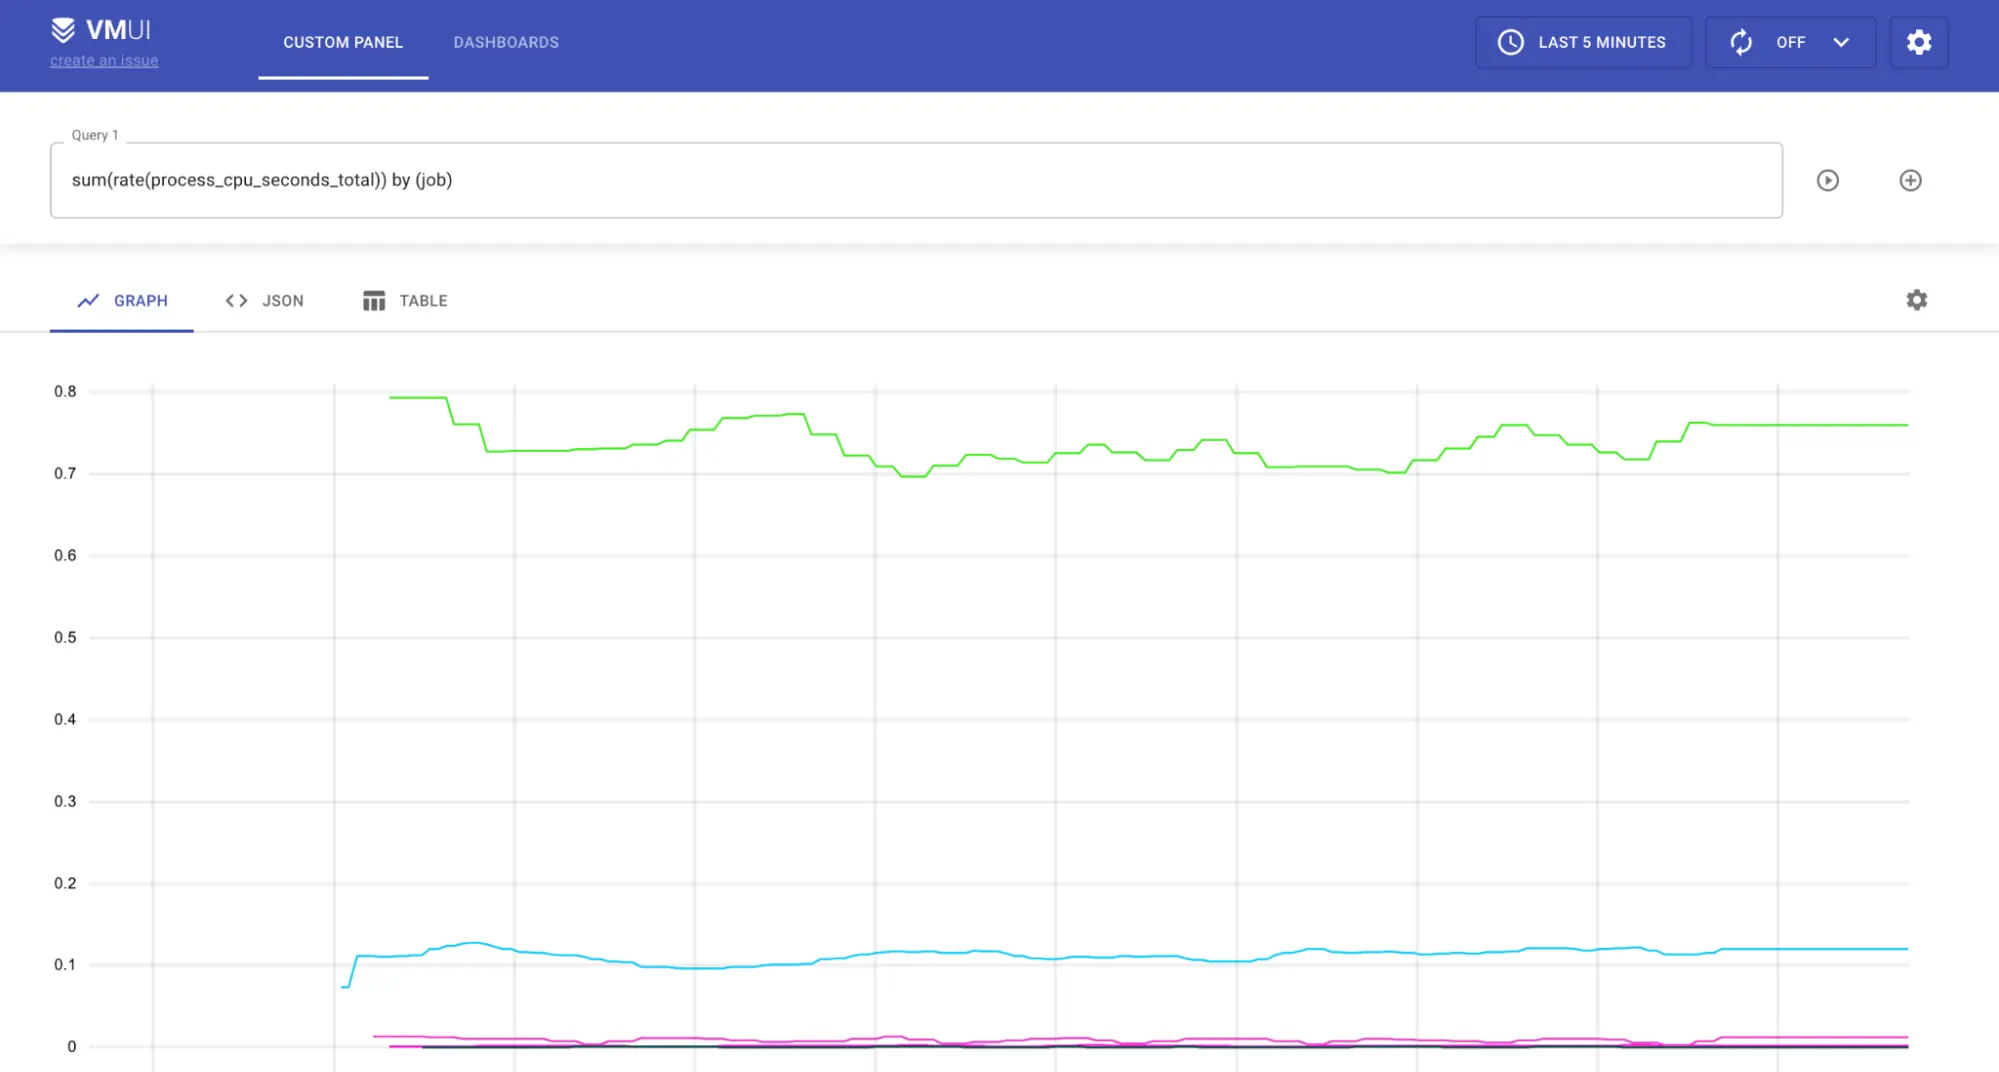

VictoriaMetrics stores and queries monitoring time series. The Community code is Apache-2.0. Enterprise features and VictoriaMetrics Cloud are separate offerings; this page covers the open-source single-node server, not a hosted subscription. It can complement Grafana rather than replace every monitoring dashboard.
Quick start
Researched against official single-server documentation and pinned nixpkgs sources on November 11, 2026. These steps have not been executed here.
Jump to: Docker Compose · Linux · NixOS
Docker Compose
For a local monitoring lab, create compose.yaml:
services:
  victoriametrics:
    image: victoriametrics/victoria-metrics:v1.156.0
    command:
      - -storageDataPath=/storage
      - -selfScrapeInterval=5s
    ports:
      - "127.0.0.1:8428:8428"
    volumes:
      - vm-data:/storage
    restart: unless-stopped
volumes:
  vm-data:
Run docker compose up -d, then open http://localhost:8428/vmui/. After a few
seconds, query process_resident_memory_bytes and click Execute Query. The
self-scrape flag supplies sample server metrics; it does not discover the rest
of your network. Data persists in the volume. docker compose down stops the
lab; adding -v erases the stored data.
Docker Compose · Open-source time-series database and monitoring backend, with a built-in query UI. Paste into your AI assistant. It may only be able to guide you. Review changes before running anything.
Researched from the project's documentation. Checked 2026-11-12. No AI account or connection is needed here.
Read or copy the prompt manually
Linux
Download the Community single-node archive for your CPU from the project’s release page, check the published checksum, and extract it. From that directory:
./victoria-metrics-prod -storageDataPath=./vm-data -httpListenAddr=127.0.0.1:8428 -selfScrapeInterval=5sKeep the terminal running and use VMUI as above. Stop with Ctrl-C. This is a lab process, not a configured system service. The server is not authenticated by default: do not expose port 8428 publicly. Arrange access control, retention and backups before using it for real monitoring.
Linux · Open-source time-series database and monitoring backend, with a built-in query UI. Paste into your AI assistant. It may only be able to guide you. Review changes before running anything.
Researched from the project's documentation. Checked 2026-11-12. No AI account or connection is needed here.
Read or copy the prompt manually
NixOS
services.victoriametrics = {
  enable = true;
  listenAddress = "127.0.0.1:8428";
  extraOptions = [ "-selfScrapeInterval=5s" ];
};
Apply with sudo nixos-rebuild switch, then open VMUI and try the same query.
The module manages the service and storage directory. The nixpkgs version can
differ from the recorded upstream release.
NixOS · Open-source time-series database and monitoring backend, with a built-in query UI. Paste into your AI assistant. It may only be able to guide you. Review changes before running anything.
Researched from the project's documentation. Checked 2026-11-12. No AI account or connection is needed here.
Read or copy the prompt manually
First use
Add explicit scrape targets or configure a Prometheus-compatible remote-write sender using the official guide. Check ingestion and retention before relying on the graphs. A local storage volume is not a backup. Keep write endpoints and query endpoints behind suitable authentication for multi-user deployments.
Documentation
Tags: Infrastructure, Self-hosted, NixOS module
Want help setting this up? Ask FOSSadmin ↗